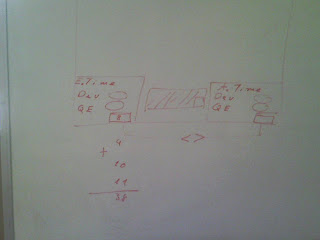
I specially like this template because it has all the necessary information in just one place, it has fields like:
- Developer's initials
- Quality Engineer (QE) initials
- User story name
- Developer's estimated time
- QE's estimated time
- Developer's actual time
- QE's actual time

By adding developer's plus QE's estimated times, one can have the total estimated time for the user story. If one does this for all user stories, one will ending up having the total schedule time for the Sprint.
 This time would be the total allocated time or time that the team has to burn during the Sprint. In the chart below we had check point every five minutes (because our simulated Sprint only lasted 15 minutes) to see how much has been worked and what is still remaining. This information is what allow all three team to draw burndown charts and use them as a tool for monitoring progress and forecast Sprint degree of completion -only from a time perspective.


No comments:
Post a Comment